
Trading in the forex market can feel like learning a new language. Charts fill your screen, prices move up and down within seconds, and you are expected to make sense of it all. But here is the good news: once you understand candlestick patterns, those charts start telling you a story. A very useful one.
Whether you are just getting started and looking for the best forex broker for beginners, or you have already spent hours trying to compare forex brokers to find the right fit, learning candlestick patterns is one of the best investments of your time. These patterns do not guarantee profits, but they give you context. They help you read what buyers and sellers are doing in real time.
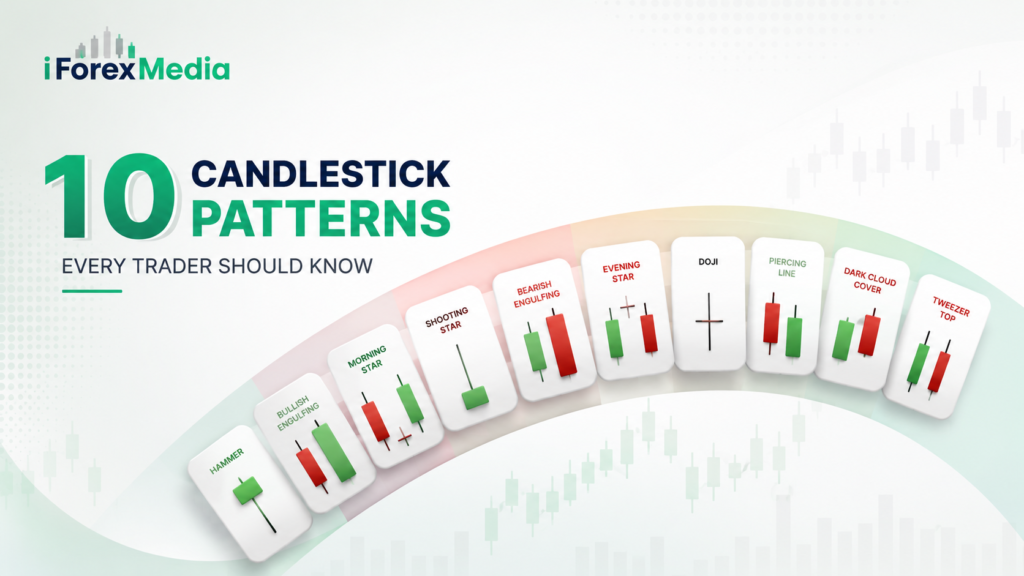
Let us walk through 10 of the most important candlestick patterns with practical notes on how to use each one.
A Quick Note on How Candlesticks Work
Before the patterns, a quick refresher. Each candlestick shows four pieces of price information for a given time period: the open, the close, the high, and the low. The body of the candle shows the range between open and close. The thin lines above and below are called wicks or shadows that show the highest and lowest prices reached during that period.
A green or white candle means the price closed higher than it opened. A red or black candle means it closed lower. That is it. Everything else is just reading combinations of these shapes.
1. The Hammer
The Hammer is a single candle with a small body near the top and a long lower wick at least twice the body’s size. It shows up at the bottom of a downtrend.
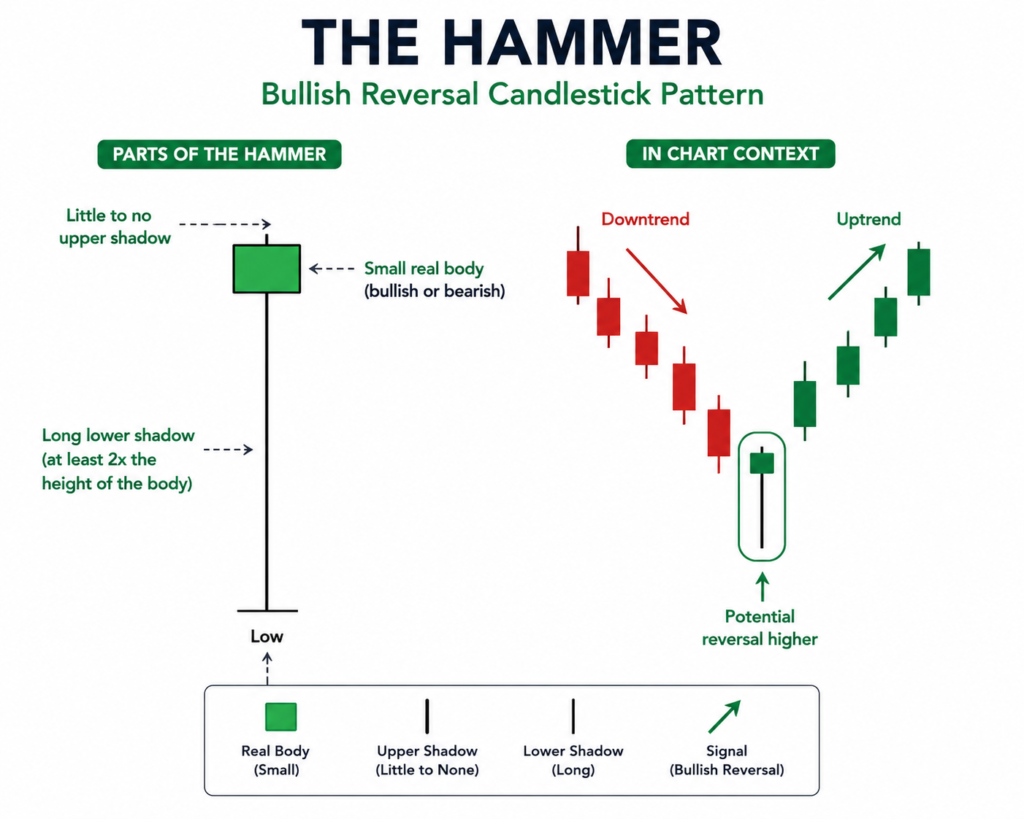
What is happening here? During the session, sellers pushed the price down significantly. But buyers stepped in with force, pushing it back up before the close. The long lower wick shows that buyers stepped in and pushed the price back up.
The Hammer shows that selling pressure may be slowing down. It does not always mean the price will reverse, but it can be a sign to pay attention. Traders usually wait for the next candle to close higher to confirm the signal.
2. The Shooting Star
Think of the Shooting Star as the Hammer flipped upside down. Small body near the bottom, long upper wick, little to no lower wick. It appears at the top of an uptrend.
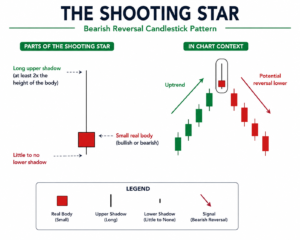
During the session, buyers pushed prices sharply higher. Then sellers took over and dragged the price back down to near the open. That long upper wick tells you buyers tried and failed to hold the gains.
This pattern suggests the uptrend could be losing steam. It is one of the more reliable single-candle reversal signals when it appears after a clear run higher.
3. The Doji
The Doji is a candle where the open and close prices are nearly identical, resulting in a very small body or no body at all. The wicks can vary in size.
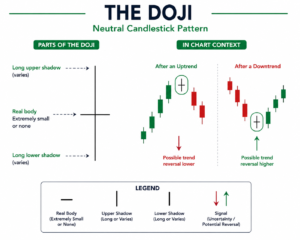
What a Doji communicates is indecision. Neither buyers nor sellers won the session. The market is at a crossroads. On its own, a Doji is not a strong signal, but it becomes meaningful when it appears after a prolonged trend.
A Doji following a strong uptrend, for instance, suggests the buying momentum is stalling. Watch the next candle to see which direction the market chooses.
4. The Bullish Engulfing Pattern
This is a two-candle pattern. The first candle is bearish, and the second candle is bullish. The key requirement is that the body of the second candle completely covers (engulfs) the body of the first.
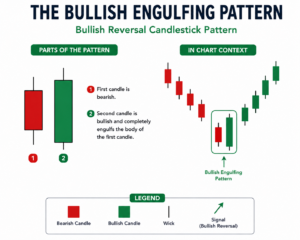
The logic is straightforward. The market was falling. Then in a single session, buyers came in so aggressively that they wiped out all the previous day’s losses. That kind of momentum shift is significant.
Bullish Engulfing patterns are most meaningful when they form after a notable decline. They are widely used by traders at all levels, including those who are still learning the ropes on a beginner-friendly platform.
5. The Bearish Engulfing Pattern
The opposite of the above. A bullish candle is followed by a bearish candle whose body fully engulfs the first. This signals that sellers have taken control after a period of buying.
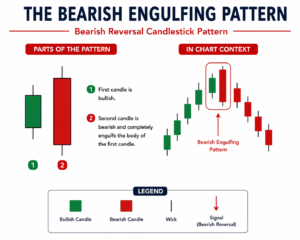
The bigger the size difference between the two candles, the stronger the signal. A massive red candle swallowing a small green one is more significant than two candles of nearly equal size.
Bearish Engulfing patterns are particularly worth paying attention to when they appear near known resistance levels on a chart.
6. The Morning Star
The Morning Star is a three-candle pattern that forms at the bottom of a downtrend, and it is one of the more reliable reversal signals available.
The first candle is a long bearish one. The second is a small-bodied candle (sometimes a Doji) that gaps below the first. This represents hesitation after the selling. The third candle is a long bullish one that closes well into the body of the first candle.
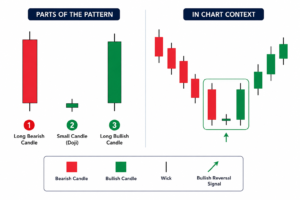
Acting in harmony, these three candles tell a story of momentum shifting from sellers to buyers. The first candle shows selling dominance. The second shows that sales are drying up. The third confirms buyers are back in charge.
When you are comparing forex brokers and looking at their educational resources, the Morning Star is usually one of the first reversal patterns they cover, and for good reason.
7. The Evening Star
The Evening Star is the bearish counterpart to the Morning Star. It forms at the top of an uptrend with three candles: a long bullish candle, a small-bodied candle that gaps above the first, then a long bearish candle that closes deep into the body of the first.
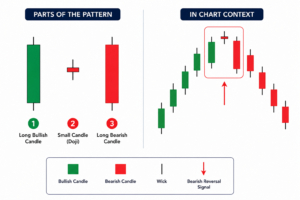
This pattern signals that buyers are running out of energy. The uptrend has been going well, but sellers are beginning to take control. It is a warning sign to traders who are holding long positions.
Like the Morning Star, confirmation is important. An Evening Star, followed by continued selling pressure, significantly increases the signal’s reliability.
8. Three White Soldiers
This pattern consists of three consecutive long bullish candles, each opening within the previous candle’s body and closing near its high.
What you are seeing is sustained, organized buying across three sessions. There is no hesitation here. Buyers are in control and driving the price steadily higher.
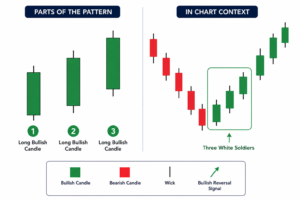
Three White Soldiers typically appear after a period of consolidation or at the end of a meaningful downtrend. It is less about a single session reversal and more about a clear change of character in the market.
9. Three Black Crows
Three Black Crows is a bearish pattern that shows strong selling pressure. It forms with three long red candles in a row, where each candle opens inside the previous candle & closes near its lowest point.
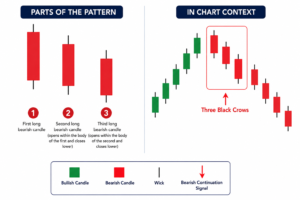
This pattern shows sustained selling over three sessions. Not panic selling, but methodical, deliberate pressure from sellers. The market is not just retracing briefly; it is shifting direction.
Traders who see Three Black Crows forming after an extended uptrend should treat it as a serious warning sign, especially if the candles are large and the wicks are minimal.
10. The Dark Cloud Cover
Dark Cloud Cover is a two-candle pattern that begins with a strong bullish candle. That is followed by a bearish candle that opens above the previous high but closes below the midpoint of the first candle’s body.
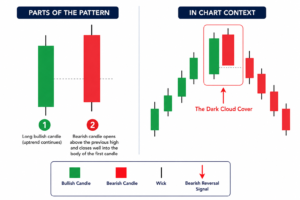
The name captures it well. A bright, bullish session is followed by a cloud rolling in. The second candle’s ability to close so far down into the previous candle’s body suggests sellers are overcoming the buying pressure.
For the pattern to be meaningful, that second candle needs to close below the 50% mark of the first. If it only dips slightly, the signal is much weaker.
How to Actually Use These Patterns
Knowing the patterns is one thing. Using them properly is another. Here are a few principles worth keeping in mind:
Context matters more than the pattern. A Hammer pattern is more important after a long downtrend than during a sideways market. Before trading any signal, always look at where it appears on the chart.
Volume adds confirmation. A Bullish Engulfing candle with high volume behind it is a stronger signal than the same pattern on thin trading. If your broker’s platform shows volume data, use it.
Never trade a pattern in isolation. Candlestick patterns work best alongside other tools. Support and resistance levels, trend lines, moving averages, and basic indicators like RSI can all help you confirm whether a pattern is worth acting on.
Timeframes change the meaning. A pattern on a 5-minute chart tells a very different story than the same pattern on a daily chart. The longer the timeframe, the more significant the pattern tends to be.
Choosing the Right Platform
If you are new to forex trading & want to practice identifying these patterns, your broker choice matters. The best forex broker for beginners will offer a demo account so you can trade with virtual money before risking real capital. Look for platforms with clean charting tools, easy navigation, and good educational resources.
Thoroughly review the charting tools on each platform when comparing forex brokers. Check whether you can switch between timeframes, draw trendlines easily, and spot candlestick patterns clearly. These features can make a big difference in your trading experience.
Some traders spend months on demo accounts purely to train their eyes to spot these patterns under real market conditions. It is time well spent.
One Last Thought
Candlestick patterns have been used by Japanese rice traders for hundreds of years. They were brought to Western financial markets in the 1990s and quickly became a core part of technical analysis.
Their staying power comes from what they represent, i.e., human psychology made visible. Fear, greed, hesitation, & momentum all leave marks on a candlestick chart. Learning to read those marks does not make you a perfect trader, but it does make you a more informed one.
Start with these ten patterns and watch for them on your charts. Pay attention to when they appear and how the market reacts afterward. With practice, they become easier to recognize and understand. That is when trading starts to feel less like guesswork and more like analysis.
Every experienced trader was once a beginner staring at charts that made no sense. Charts are not shortcuts, but they are solid building blocks. Learn them well and practice them consistently. In trading, patience and persistence always pay off in the end.
The forex market is constantly evolving, and staying informed is of the utmost need. Follow iForexMedia for trusted reviews, useful trading insights, and straightforward educational content.

⭐ Broker Spotlight